Edward E. Hood Jr. Chair in Nuclear Engineering
Director Gaerttner LINAC Center
Nuclear Engineering Program Director

Research
NUCLEAR DATA
My main research interest is Nuclear Data, more specifically Nuclear Data related to Nuclear Fission and Fusion applications. In these application neutrons play an important role in energy production.
In this research we try to answer questions like:
- How do neutrons interact with materials?
- What is the probability that a neutron will interact in a specific way? For example the neutron can be scattered, induce fission, or be absorbed.
- What are the products of neutron interactions?
- How accurate is the data used for neutron transport calculations?
- How can we improve the accuracy of our reactor calculation predictions?
 Because neutron interactions are a complex process that is not completely understood, theory alone cannot provide the answer to these questions. Our research uses neutrons generated by the RPI LINAC to preform experiments that answer these questions. Specific experiments are conducted to answer each of the questions above. For example by passing a neutron beam through a sample material (such as U-238), and measuring the fraction of the beam that does not interact, the probability for neutron interaction can be determined. This probability is referred to as the total neutron interaction cross section.
Examples of experiments performed at the Gaerttner LINAC center include: Neutron transmission – measure the total interaction cross section
- Neutron Capture – measure the neutron capture yield (for a thin sample approximately the capture cross section)
- Neutron fission – measure the fission yield (for a thin sample approximately the fission cross section)
- Fission fragment yields – measure the fission fragment yield as a function of neutron energy.
- Neutron scattering – measures the probability of neutron scattering to different angles.
 Sometimes we use experiments also to verify physics models used in different computational code. One such example as an experiment on neutron resonance scattering we performed with U-238. This experiment demonstrated that current model in different Monte Carlo codes under predicted back scattering by nearly a factor of 2.
The research in this area includes cross-section measurements with the RPI LINAC and other facilities. The RPI LINAC is used to measure transmission, capture and fission cross-sections. The cross sections are measured with thermal and epithermal neutrons. The RPI enhanced thermal target was designed and constructed as part of my PhD. Thesis. This target is still used in today's measurements. The target is optimized to generate high thermal and sub-thermal neutron flux. RPI hosts the one of two slowing-down spectrometer in the USA and one of the few in the world. As part of the research the high flux in the lead spectrometer was used to measure cross section of nano-grams of short-half life isotopes. We are now exploring the possibility of using the lead slowing down spectrometer for measurements of capture cross sections.
FISSION
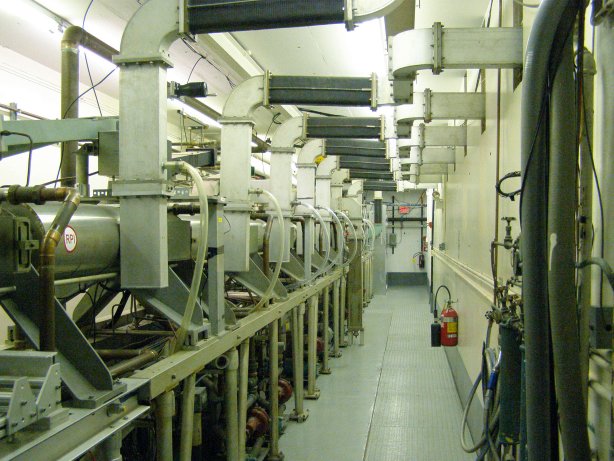
The RPI lead slowing down spectrometer (LSDS) is a unique tool that can be used to study the fission process of a sample of small quantities or a sample with small cross section. The spectrometer utilizes a LINAC driven pulsed neutron source in the center of a lead cube 1.8m on a side. The neutrons emitted in the center of the cube are slowed down by successive scattering collision with the lead. This process results in a high neutron flux in the lead cube.
A sample placed inside the lead cube can be interrogated by the high neutron flux. The increase in the neutron flux come with a cost of degradation in the energy resolution. The energy resolution of our LSDS is about 30% in the energy range from 1 eV to 50 keV. For comparison, the neutron flux inside the LSDS is about 10000 times larger than the flux incident on a sample in a conventional time-of-flight experiment with a flight path distance of 5 meters. The RPI LSDS was previously used for fission cross section measurements on variety of actinides with the heaviest being Es-254. Typically these isotopes are hard to obtain and are limited to small quantities due to high activity or limited inventory.
In this research we are adding another dimension to these measurements. We are designing a double girded fission chamber that will allow in addition to the cross section measurements to also measure the fission fragments mass and energy distributions. This type of measurements will give a very detailed picture of the fission process as a function of the neutron energy.
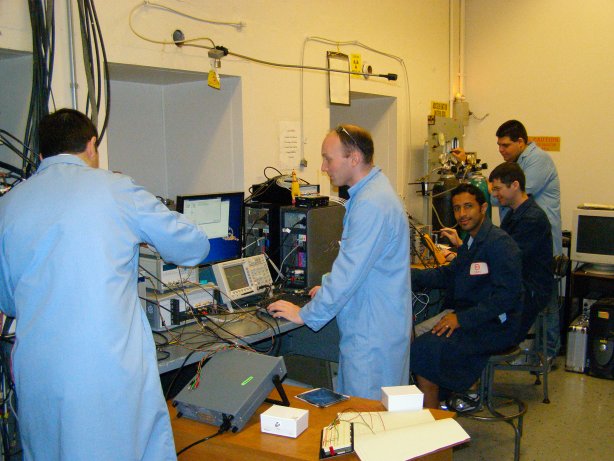
Experiments
The experimental setup includes the RPI LSDS shown in the figure 1
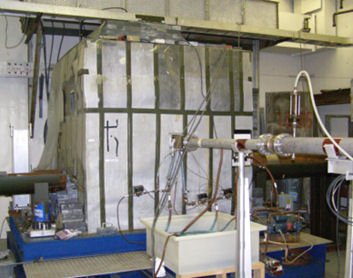 Figure 1 – The RPI lead slowing down spectrometer
The fission detector that was developed is shown in figure 2. The detector is a double gridded fission chamber. The sample located in the center of the chamber is deposited on thin gold coated Mylar films. The chamber is designed such that when a fission event occurs the fission fragments will be emitted to both sides of the fission chamber. Information about the mass and energy of the fission fragments is obtained by from the signals of the grids and anodes. 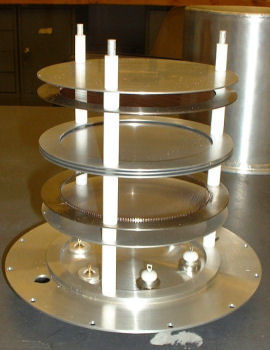 Figure 2 – The RPI double gridded fission chamber.
This reearch was supported by DOE-SSAA grant number DE-FG03-03NA00079.
NON-DESTRUCTIVE TESTING
In this research we utilizes the lead slowing down spectrometer for assay of spent fuel. We are now exploring the possibility of experimenting with a system for tomography of spent fuel.
Research is also being done on the use of magnetic methods such as eddy currents and Barkhausen noise to characterize defects in materials and under coatings. A teaming effort is underway with the Fatigue & Fracture Analysis Team at Benet Laboratories, US Army Armament Research, Development and Engineering Center, Watervliet, NY. Efforts are currently focussing on applying eddy current methods to identify different microstructural phases in magnetron sputtered tantalum coatings on steel substrates. Eddy current methods are also being explored for identifying the presence of corrosion under polymer coatings (i.e. paint and primer systems) on steel and aluminum surfaces.
Search publications for more informationPYROELECTRIC ACCELERATION
 Animaiton of a double crystal pyroelectric acceleratorThis research is focused on understanding the pyroelectric effect in order to use it to effectively accelerate electrons and ions. The accelerated electrons and ions can be used to produce beams of electrons, ions, x-rays, and possibly monoenergetic neutrons and gamma rays. The first application of the pyroelectric effect for x-ray production was reported by Brownridge. The first commercial compact x-ray source was manufactured by Amptek. The goal of our research is to further develop this technology in order to achieve higher acceleration potential and current. Such improvements will allow us to use this technology to create useful highly compact, battery operated, high energy x-rays, and neutron sources.
Pyroelectric crystals are spontaneously polarized along an axis. In other words, they have a bulk dipole moment that exists in equilibrium conditions and does not sum to zero over the volume of the crystal. This polarization is usually masked by the gradual accumulation of surface charges. The distinguishing trait of pyroelectric crystals is that the polarization of the crystal is altered dramatically with changes in the temperature of the crystal, such that the polarization is no longer masked and a large voltage can be observed across the crystal. The pyroelectric effect allows to easily achieve very high electric potentials by heating a small (~4mm x 4mm x 4mm) crystal in a low-pressure (0.5-10 mTorr) environment. We successfully used this effect to demonstrate production of x-rays with energies up to 200 keV.
Experiment
Most of the work is done with LiTaO3 but some was also done with LiNbO3. The crystals range in thickness from 1 to 10 mm with typical area of 14-25 mm2. During operation, the crystals are maintained in a vacuum chamber with a pressure of 0.5-10 mTorr. The crystals are heated to about 160 ºC and the measurements are done during the crystal heating or cooling phases. Most of the emissions occur at temperatures above 30 ºC
Electrons and ions
Several measurements were done using a surface barrier detector to directly detect electrons and ions. A typical electron spectrum and ion spectra are shown in figures 1 and figure 2. The electron spectrum is obtained during a cooling cycle with Z- side of the crystal is facing the surface barrier detector. The ion spectrum is obtained by revering the crystal polarity such that during the cooling cycle the Z+ is facing the detector. The spectrum in figure 1(a) shows unique pileup peaks, calculations indicates that this pileup is much higher than what is expected from random coincidence pile-up. This gives an indicates on the "bunched" nature of the electron emission from these crystals.
| Figure 1 – Typical electron spectrum from a single LiTaO3 crystal, measured using a surface barrier detector (a) pileup spectrum (b) high energy spectrum |

 Figure 2 – Typical ion spectrum obtained during cooling of a LiTaO3 crystal with the Z+ facing the detector.
X-ray Production
When accelerate electrons hit the crystals or other metallic targets bremsstrahlung and characteristic X-rays are produced. These photons are detected using an Amptek x-ray detector XR-100CDT. We examined the possibility of multiplying the acceleration potential by using two pyroelectric crystals. Figure 3 shows the geometry of such an experiment with paired crystals and Figure 4 shows the typical spectrum, A 6 mm thick SST absorber was used in order to reduce the low energy x-ray rate.
 Figure 3 – Paired crystal system. Figure 3 – Paired crystal system. |
 Figure 4 – The x-ray spectrum sum from 5 cooling cycles. Figure 4 – The x-ray spectrum sum from 5 cooling cycles. |
Such spectrum has high enough energy to fluoresce lead and thorium. The geometry use to demonstrate thorium fluorescent is shown in Figure 5; such geometry utilized the pyroelectrically generated x-rays to fluoresce the thorium sample in transmission geometry and the spectrum obtained is shown in figure 6. In this case the sample is radioactive and will fluoresce by excitations from the radioactive decay. This emission is treated as background, figure 6 shows the background and the pyro-x-rays induced fluorescent.
 Figure 5 – The geometry used for lead florescent measurement. Figure 5 – The geometry used for lead florescent measurement. |
 Figure 6 – x-ray florescent spectrum from thorium. Figure 6 – x-ray florescent spectrum from thorium. |
Lead fluorescet was done in a “reflection” geometry and the results are show in Figure 7.
 Figure 7 – x-ray florescent spectrum from lead.
NEUTRON PRODUCTION
Neutron production from such device is now under investigation. The idea is to use a paired crystal accelerator with a low pressure fille (5-20 mTorr) of D2 gas. In addition to the gas we would use a deuterium enriched target (such as deuterated plastic). The deuterium will be accelerated towards the deuterated target and if the right conditions exist, a D-D reaction will take place. This reaction is accompanies by a 2.5 MeV neutrons that can be detected outside the vacuum chamber. This type of accelerator can also be used on a target containing tritium to obtain a higher yield of D-T neutrons with energy of 14 MeV. Check our latest publication below which provides all the details of our neutron generator. This figure shows the neutron output from our "Doubel Crystal Fusion" device. The neutron spectrum is measured using a liquid scintilator. The spectrum was calcibrated using gamma sources and thus the x-axis energy is given in units of recoiled electron energy.
 Figure 8 – Neutron production from a double crystal system
Search publications for more information
Figure 8 – Neutron production from a double crystal system
Search publications for more information
RADIATION TRANSPORT
For this area we use Monte Carlo calculations of neutrons, photons and electron transport. These calculations are used to optimize the neutron production of the LINAC and to calculate the response of various detectors used for cross section measurements. We also investigating efficient algorithms for Monte Carlo simulations of stochastic transport in 2D and 3D.
Search publications for more information