Fastai - Revisiting Titanic
rpi.analyticsdojo.com
47. Titanic Fastai
from fastai import *
from fastai.tabular import *
import numpy as np
import pandas as pd
import pandas as pd

train= pd.read_csv('https://raw.githubusercontent.com/rpi-techfundamentals/fall2018-materials/master/input/train.csv')
test = pd.read_csv('https://raw.githubusercontent.com/rpi-techfundamentals/fall2018-materials/master/input/test.csv')
#Create a categorical variable from the family count
def family(x):
    if x < 2:
        return 'Single'
    elif x == 2:
        return 'Couple'
    elif x <= 4:
        return 'InterM'
    else:
        return 'Large'


for df in [train, test]:
    df['Title'] = df['Name'].str.split(',').str[1].str.split(' ').str[1]
    df['Title'] = df['Title'].replace(['Lady', 'the Countess', 'Countess', 'Capt', 'Col', 'Don', 'Dr', 'Major', 'Rev', 'Sir', 'Jonkheer', 'Dona', 'Ms', 'Mme', 'Mlle'], 'Rare')
    df['Age']=df['Age'].fillna(df['Age'].median())
    df['Fare']=df['Fare'].fillna(df['Fare'].median())
    df['Embarked']=df['Embarked'].fillna('S')
    df['NameLength'] = df['Name'].map(lambda x: len(x))
    df['FamilyS'] = df['SibSp'] + df['Parch'] + 1
    df['FamilyS'] = df['FamilyS'].apply(family)
train.isnull().sum(axis = 0)
PassengerId      0
Survived         0
Pclass           0
Name             0
Sex              0
Age              0
SibSp            0
Parch            0
Ticket           0
Fare             0
Cabin          687
Embarked         0
Title            0
NameLength       0
FamilyS          0
dtype: int64
train.head()
| PassengerId | Survived | Pclass | Name | Sex | Age | SibSp | Parch | Ticket | Fare | Cabin | Embarked | Title | NameLength | FamilyS | |
|---|---|---|---|---|---|---|---|---|---|---|---|---|---|---|---|
| 0 | 1 | 0 | 3 | Braund, Mr. Owen Harris | male | 22.0 | 1 | 0 | A/5 21171 | 7.2500 | NaN | S | Mr. | 23 | Couple |
| 1 | 2 | 1 | 1 | Cumings, Mrs. John Bradley (Florence Briggs Th... | female | 38.0 | 1 | 0 | PC 17599 | 71.2833 | C85 | C | Mrs. | 51 | Couple |
| 2 | 3 | 1 | 3 | Heikkinen, Miss. Laina | female | 26.0 | 0 | 0 | STON/O2. 3101282 | 7.9250 | NaN | S | Miss. | 22 | Single |
| 3 | 4 | 1 | 1 | Futrelle, Mrs. Jacques Heath (Lily May Peel) | female | 35.0 | 1 | 0 | 113803 | 53.1000 | C123 | S | Mrs. | 44 | Couple |
| 4 | 5 | 0 | 3 | Allen, Mr. William Henry | male | 35.0 | 0 | 0 | 373450 | 8.0500 | NaN | S | Mr. | 24 | Single |
dep_var = 'Survived'
cat_names = ['Pclass', 'Sex', 'Embarked', 'Title', 'FamilyS']
cont_names = ['Age', 'Fare', 'SibSp', 'Parch', 'NameLength']
procs = [FillMissing, Categorify, Normalize]
test_data = (TabularList.from_df(test, path='.', cat_names=cat_names, cont_names=cont_names, procs=procs))
data = (TabularList.from_df(train, path='.', cat_names=cat_names, cont_names=cont_names, procs=procs)
                           .split_by_idx(list(range(0,200)))
                           .label_from_df(cols=dep_var)
                           .add_test(test_data, label=0)
                           .databunch())
#Shows the Data
data.show_batch()
| Pclass | Sex | Embarked | Title | FamilyS | Age | Fare | SibSp | Parch | NameLength | target |
|---|---|---|---|---|---|---|---|---|---|---|
| 2 | male | S | Mr. | Couple | 0.5653 | -0.1432 | 0.5043 | -0.4658 | -0.4163 | 0 |
| 3 | male | S | Mr. | Single | -0.3706 | -0.4860 | -0.4610 | -0.4658 | -0.6319 | 0 |
| 3 | male | S | Mr. | Single | -0.1366 | -0.4982 | -0.4610 | -0.4658 | -0.5241 | 0 |
| 3 | male | S | Mr. | Single | 3.4510 | -0.4883 | -0.4610 | -0.4658 | -0.8475 | 0 |
| 3 | male | S | Mr. | Couple | -0.9165 | -0.5125 | 0.5043 | -0.4658 | -0.2008 | 0 |
#Define our Learner
learn = tabular_learner(data, layers=[300,100], metrics=accuracy)
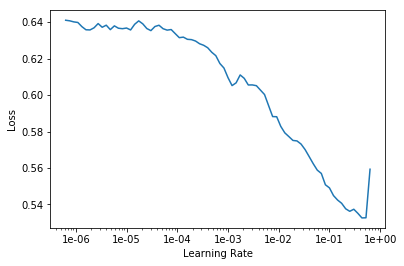
learn.lr_find()
learn.recorder.plot()
LR Finder is complete, type {learner_name}.recorder.plot() to see the graph.

#fit the learner
learn.fit(7, 1e-2)  #Number of epocs and the learning rate. learn.save('final_train')
| epoch | train_loss | valid_loss | accuracy | time |
|---|---|---|---|---|
| 0 | 0.544682 | 0.566284 | 0.740000 | 00:00 |
| 1 | 0.490425 | 0.473522 | 0.845000 | 00:00 |
| 2 | 0.467682 | 0.453977 | 0.845000 | 00:00 |
| 3 | 0.448043 | 0.414292 | 0.830000 | 00:00 |
| 4 | 0.434118 | 0.406961 | 0.865000 | 00:00 |
| 5 | 0.424244 | 0.426844 | 0.855000 | 00:00 |
| 6 | 0.413750 | 0.411579 | 0.845000 | 00:00 |
#Show the results
learn.show_results()
| Pclass | Sex | Embarked | Title | FamilyS | Age | Fare | SibSp | Parch | NameLength | target | prediction |
|---|---|---|---|---|---|---|---|---|---|---|---|
| 3 | male | S | Mr. | Couple | -0.6046 | -0.4982 | 0.5043 | -0.4658 | -0.4163 | 0 | 0 |
| 1 | female | C | Mrs. | Couple | 0.6433 | 0.7144 | 0.5043 | -0.4658 | 2.6017 | 1 | 1 |
| 3 | female | S | Miss. | Single | -0.2926 | -0.4855 | -0.4610 | -0.4658 | -0.5241 | 1 | 0 |
| 1 | female | S | Mrs. | Couple | 0.4093 | 0.3700 | 0.5043 | -0.4658 | 1.8472 | 1 | 1 |
| 3 | male | S | Mr. | Single | 0.4093 | -0.4831 | -0.4610 | -0.4658 | -0.3085 | 0 | 0 |
#This will get predictions
predictions, *_ = learn.get_preds(DatasetType.Test)
labels = to_np(np.argmax(predictions, 1))
labels.shape
(418,)
#Writing to File
submission=pd.DataFrame(test.loc[:,['PassengerId']])
submission['Survived']=labels
#Any files you save will be available in the output tab below

submission.to_csv('submission.csv', index=False)
from google.colab import files
files.download('submission.csv')

